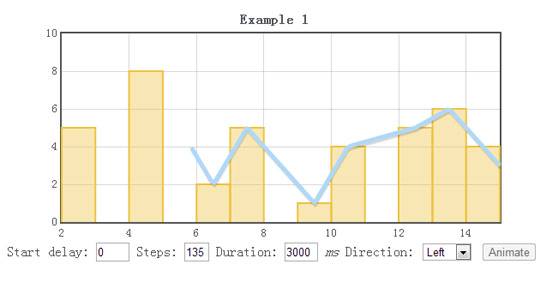
动画统计,包括曲线,柱状图等

XML/HTML Code
- <table style="margin-left:auto;margin-right:auto;">
- <tr>
- <td style="text-align:center;"><h3 style="margin-bottom:0px;">Example 1</h3>
- <div id="chart1" style="width:540px;height:250px;padding:5px;"></div>
- <div style="text-align:right;padding-right:5px;"> Start delay:
- <input id="start" style="width:35px" value="0" />
- Steps:
- <input id="steps" style="width:25px" value="135" />
- Duration:
- <input id="duration" style="width:35px" value="3000" />
- <i>ms</i> Direction:
- <select id="dir">
- <option value="right">Right</option>
- <option value="left" selected>Left</option>
- </select>
- <button id="bnt1" type="button">Animate</button>
- </div></td>
- </tr>
- <tr>
- <td style="text-align:center;"><h3 style="margin-bottom:0px;">Example 2</h3>
- <div id="chart2" style="width:540px;height:250px;padding:5px;"></div>
- <button id="bnt2" type="button">Animate</button></td>
- </tr>
- <tr>
- <td style="text-align:center;"><h3 style="margin-bottom:0px;">Example 3</h3>
- <div id="chart3" style="width:540px;height:250px;padding:5px;"></div>
- <button id="bnt3" type="button">Animate</button></td>
- </tr>
- <tr>
- <td style="text-align:center;"><h3 style="margin-bottom:0px;">Example 4</h3>
- <div id="chart4" style="width:540px;height:250px;padding:5px;"></div>
- <button id="bnt4" type="button">Animate</button></td>
- </tr>
- </table>
JavaScript Code
- <script type="text/javascript">
- $(window).load(function () {
- var d8 = [[2, 5],[4, 8],[6, 2],[7, 5],[9,1],[10, 4],[12, 5],[13, 6],[14, 4]];
- var d9 = [[2, 4],[2.5, 5],[4.5, 8],[6.5, 2],[7.5, 5],[9.5,1],[10.5, 4],[12.5, 5],[13.5, 6],[14.5, 4],[15, 3]];
- var plot1 = $.plotAnimator($("#chart1"), [{data : d8, bars: { show: true, fill: true}},{data : d9, lines: {lineWidth:5}, animator: {start:$("#start").val(), steps:$("#steps").val(), duration:$("#duration").val(), direction: $("#dir").val()}}]);
- $("#bnt1").attr("disabled", "disabled");
- $("#chart1").on("animatorComplete", function() {
- $("#bnt1").removeAttr("disabled")
- });
- $("#bnt1").on("click",function() {
- $("#bnt1").attr("disabled", "disabled");
- plot1 = $.plotAnimator($("#chart1"), [{data : d8, bars: { show: true, fill: true}},{data : d9, lines: {lineWidth:5}, animator: {start:$("#start").val(), steps:$("#steps").val(), duration:$("#duration").val(), direction: $("#dir").val()}}]);
- });
- var d0 = [[2, 5], [4, 8], [6, 2], [7, 3], [10, 4], [12, 5], [13, 6], [14, 4]];
- var plot2 = $.plotAnimator($("#chart2"), [{ data: d0, animator: {steps: 136, duration: 2500, start:0}, lines: { show: true, fill: false },label: "Let's Go" }],{grid: { backgroundColor: { colors: [ "#fff", "#eee" ] }}});
- $("#bnt2").attr("disabled", "disabled");
- $("#chart2").on("animatorComplete", function() {
- $("#bnt2").removeAttr("disabled")
- });
- $("#bnt2").on("click",function() {
- $("#bnt2").attr("disabled", "disabled");
- plot2 = $.plotAnimator($("#chart2"), [{ data: d0, animator: {steps: 136, duration: 2500, start:0}, lines: { show: true, fill: false },label: "Let's Go" }],{grid: { backgroundColor: { colors: [ "#fff", "#eee" ] }}});
- });
- var d5 = [[1, 4], [2, 2], [4, 4], [6, 2], [8, 4], [10, 2], [15, 4], [20, 2]];
- var d6 = [[1, 3], [20, 3]];
- var plot3 = $.plotAnimator($("#chart3"), [{ data: d5, animator: {steps: 136, duration: 2000, start:0}, lines: { show: true, fill: true }, label: "Fill this"}, { data: d6, lines: { show: true, fill: false}, label: "Standard Values" }],{grid: { backgroundColor: { colors: [ "#fff", "#ebe" ] }}});
- $("#bnt3").attr("disabled", "disabled");
- $("#chart3").on("animatorComplete", function() {
- $("#bnt3").removeAttr("disabled")
- });
- $("#bnt3").on("click",function() {
- $("#bnt3").attr("disabled", "disabled");
- plot3 = $.plotAnimator($("#chart3"), [{ data: d5, animator: {steps: 136, duration: 2000, start:0}, lines: { show: true, fill: true }, label: "Fill this"}, { data: d6, lines: { show: true, fill: false}, label: "Standard Values" }],{grid: { backgroundColor: { colors: [ "#fff", "#ebe" ] }}});
- });
- var d2 = [];
- for (var i = 0 ; i < 20.1 ; i += 0.1) d2.push([i, Math.sin(i)]);
- var d3 = [[0, 0], [20, 0]];
- var plot4 = $.plotAnimator($("#chart4"), [{ data: d2, animator: {steps: 136, duration: 3000, start:0}, lines: { show: true, fill: true }, label: "sin(x)" }, { data: d3, lines: { show: true, fill: false } }, { data: d2, lines: { show: true, fill: false } }],{grid: { backgroundColor: { colors: [ "#fff", "#eee" ] }}});
- $("#bnt4").attr("disabled", "disabled");
- $("#chart4").on("animatorComplete", function() {
- $("#bnt4").removeAttr("disabled")
- });
- $("#bnt4").on("click",function() {
- $("#bnt4").attr("disabled", "disabled");
- plot4 = $.plotAnimator($("#chart4"), [{ data: d2, animator: {steps: 136, duration: 3000, start:0}, lines: { show: true, fill: true }, label: "sin(x)" }, { data: d3, lines: { show: true, fill: false } }, { data: d2, lines: { show: true, fill: false } }],{grid: { backgroundColor: { colors: [ "#fff", "#eee" ] }}});
- });
- });
- </script>
原文地址:http://www.freejs.net/article_jquerywenzi_158.html
最近更新
- jQuery轮播图插件slider-...
- CSS3鼠标悬停图片遮罩层变形动画特...
- 响应式全屏手风琴菜单,同时支持垂直方...
- 分组select选择器,支持多选和单...
- jQuery时间日期选择器代码日历插...
- Select 选择器 可以清空的单选...
我爱薅羊毛
点击最多
广告赞助
相关文章
- jquery点击显示或隐藏内容,可以一次展开多个和...
- tooltips/弹出层/消息提示效果,支持点击与...
- jQuery幸运大转盘抽奖活动代码
- jquery来实现的添加商品和减少商品数量,用于购...
- jQuery手机端弹出层提示对话框
- php js实现拖动滑块完成拼图验证码

