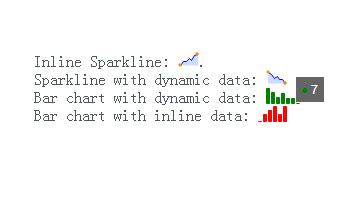
js线性统计图

XML/HTML Code
- <p> Inline Sparkline: <span class="inlinesparkline">1,4,4,7,5,9,10</span>. </p>
- <p> Sparkline with dynamic data: <span class="dynamicsparkline">Loading..</span> </p>
- <p> Bar chart with dynamic data: <span class="dynamicbar">Loading..</span> </p>
- <p> Bar chart with inline data: <span class="inlinebar">1,3,4,5,3,5</span> </p>
JavaScript Code
- <script type="text/javascript">
- /* <![CDATA[ */
- $(function() {
- /** This code runs when everything has been loaded on the page */
- /* Inline sparklines take their values from the contents of the tag */
- $('.inlinesparkline').sparkline();
- /* Sparklines can also take their values from the first argument passed to the sparkline() function */
- var myvalues = [10,8,5,7,4,4,1];
- $('.dynamicsparkline').sparkline(myvalues);
- /* The second argument gives options such as specifying you want a bar chart */
- $('.dynamicbar').sparkline(myvalues, {type: 'bar', barColor: 'green'} );
- /* Use 'html' instead of an array of values to pass options to a sparkline with data in the tag */
- $('.inlinebar').sparkline('html', {type: 'bar', barColor: 'red'} );
- });
- /* ]]> */
- </script>
原文地址:http://www.freejs.net/article_jquerywenzi_225.html

