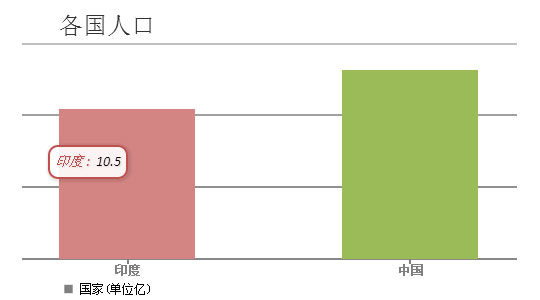
js 生成简单的柱状图
本例与jquery无关,算是简单的柱状图,不需要很复杂,数据获取也很方便

XML/HTML Code
- <div id="chartContainer" style="height: 300px; width: 100%;"> </div>
JavaScript Code
- <script type="text/javascript">
- window.onload = function () {
- var chart = new CanvasJS.Chart("chartContainer",
- {
- title:{
- text: "各国人口",
- },
- axisY: {
- title: "人口"
- },
- legend: {
- verticalAlign: "bottom",
- horizontalAlign: "center"
- },
- theme: "theme2",
- data: [
- {
- type: "column",
- showInLegend: true,
- legendMarkerColor: "grey",
- legendText: "国家(单位亿)",
- dataPoints: [
- {y: 2.90342554, label: "美国" },
- {y: 10.49700118, label: "印度"},
- {y: 13.17442552, label: "中国"},
- ]
- },
- ]
- });
- chart.render();
- }
- </script>
原文地址:http://www.freejs.net/article_jquerywenzi_324.html
最近更新
- CSS3鼠标悬停图片遮罩层变形动画特...
- 响应式全屏手风琴菜单,同时支持垂直方...
- 分组select选择器,支持多选和单...
- jQuery时间日期选择器代码日历插...
- Select 选择器 可以清空的单选...
- jQuery json 无刷新翻页 ...
我爱薅羊毛
点击最多
广告赞助
相关文章
- jquery点击显示或隐藏内容,可以一次展开多个和...
- tooltips/弹出层/消息提示效果,支持点击与...
- jQuery幸运大转盘抽奖活动代码
- jquery来实现的添加商品和减少商品数量,用于购...
- jQuery手机端弹出层提示对话框
- php js实现拖动滑块完成拼图验证码

